


Existing Home Sales Continue to Collapse
By: Robert Hughes
Sales of existing homes sank another 5.9 percent in July, to a 4.81 million seasonally adjusted annual rate. That is the sixth consecutive monthly decline leaving the selling pace at the lowest level since May 2020, the low of the lockdown recession. Excluding the lockdown recession, sales are at their lowest since November 2015. Sales were down 20.2 percent from a year ago and 25.9 percent from the January peak.
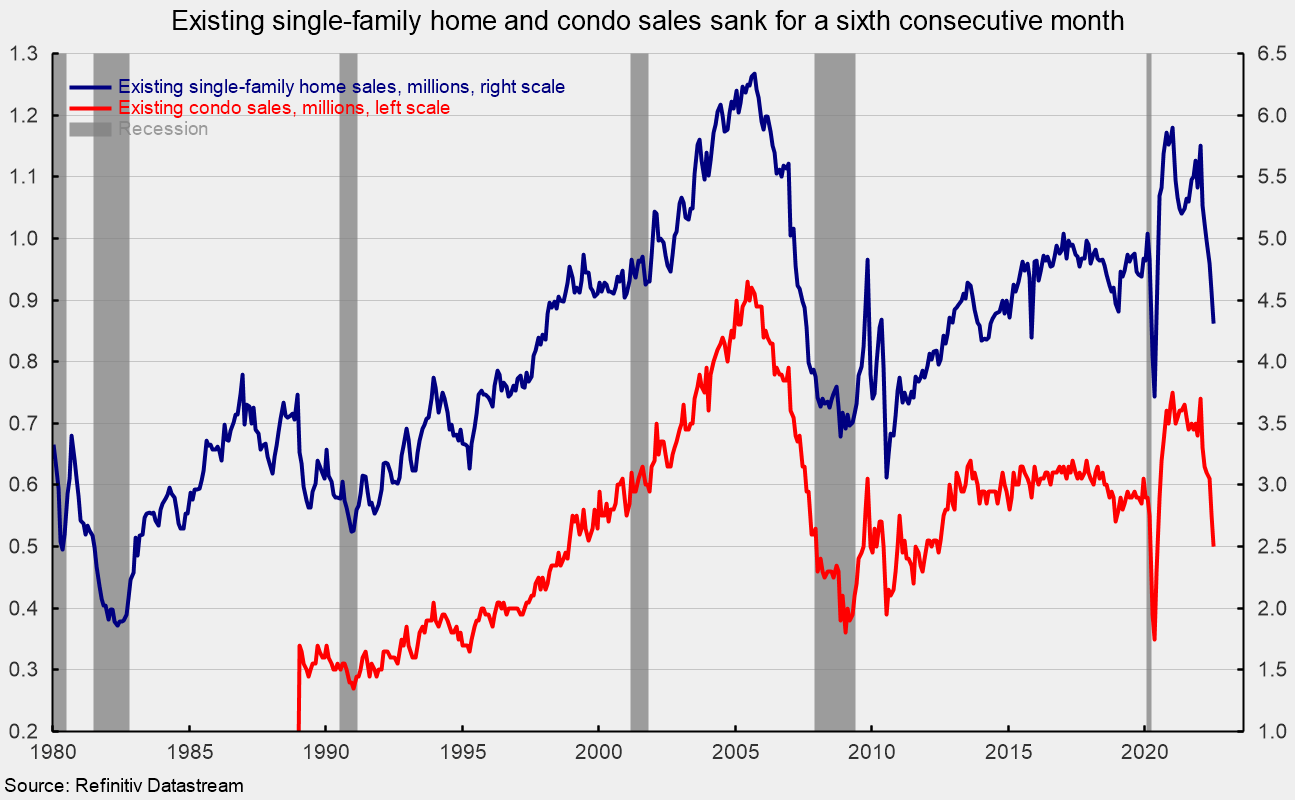
Sales in the market for existing single-family homes, which account for about 89 percent of total existing-home sales, dropped 5.5 percent in July, coming in at a 4.31 million seasonally adjusted annual rate (see first chart). Sales are down 19.0 percent from a year ago and 25.0 percent from the January peak. Single-family sales also fell for the sixth consecutive month and were at their slowest pace since the May 2020 lockdown recession.
The single-family segment saw sales decline in all four regions. Sales fell 9.5 percent in the West, 5.5 percent in the South, the largest region by volume, 5.4 percent in the Northeast, the smallest region by volume, and 2.6 percent in the Midwest. Sales were down double-digits in all four regions from a year ago (-30.3 percent in the West, -17.5 percent in the South, -15.9 percent in the Northeast, and -13.7 percent in the Midwest). Sales are also below the December 2019 pre-lockdown level in all four regions.
Condo and co-op sales fell 9.1 percent for the month, leaving sales at a 500,000 annual rate for the month versus 550,000 in June (see first chart). Measured from a year ago, condo and co-op sales were off 29.6 percent, and were at their slowest pace since June 2020.
Condo and co-op sales were down in all four regions in July, falling 18.2 percent in the Northeast, 14.3 percent in the Midwest, 8.3 percent in the West, and 4.0 percent in the South. From a year ago, sales were also down in all four regions (-33.3 percent in the South, -31.3 percent in the West, -25.0 percent in the Midwest, and-18.2 percent in the Northeast).

Total inventory of existing homes for sale rose in July, increasing by 4.8 percent to 1.31 million, leaving the months’ supply (inventory times 12 divided by the annual selling rate) up 0.4 months at 3.3, the sixth consecutive increase and the highest since June 2020, but still low by historical comparison.
For the single-family segment, inventory was up 5.4 percent for the month at 1.17 million and is 3.5 percent above the July 2021 level. The months’ supply was 3.3, up from 2.9 in the prior month, the highest since June 2020 (see second chart). Through June 2022, the months’ supply of new single-family homes on the market had surged to 9.3 months, the highest May 2010, and a very high (weak) reading by historical comparison (see second chart).
The condo and co-op inventory increased 5.1 percent to 144,000, pushing the months’ supply up to 3.5 from 3.0 in June. Months’ supply is 16.7 percent above July 2021 and has risen for six consecutive months.

The median sale price in July of an existing home was $403,800, 10.8 percent above the year ago price. For single-family existing home sales in July, the price was $410,600, a 10.6 percent rise over the past year (see third chart). The median price for a condo/co-op was $345,000, 9.9 percent above July 2021.
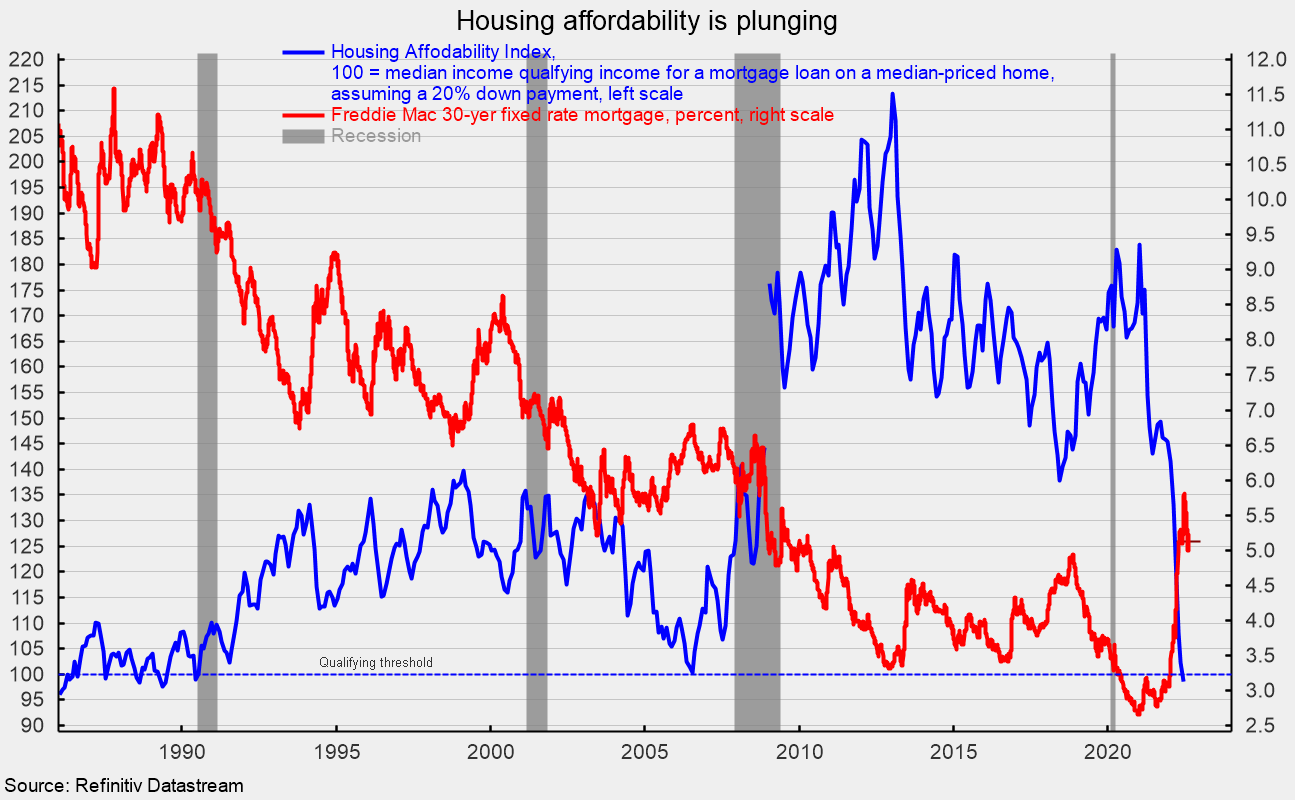
Mortgage rates have eased back recently, hitting 5.22 percent around mid-August, down from a peak around 5.81 percent in late June but still well above the lows around 2.65 percent in January 2021 (see fourth chart).
The combination of near-record-high home prices and sharply higher mortgage rates has sent housing affordability plunging. The Housing Affordability Index from the National Association of Realtors measures whether or not a typical family could qualify for a mortgage loan on a typical home. A typical home is defined as the national median-priced, existing single-family home as calculated by NAR. The typical family is defined as one earning the median family income as reported by the U.S. Bureau of the Census. A value of 100 means that a family with the median income has exactly enough income to qualify for a mortgage on a median-priced home. An index above 100 signifies that a family earning the median income has more than enough income to qualify for a mortgage loan on a median-priced home, assuming a 20% down payment. As of June, the index stood at 98.5, the lowest since June 1989 (see fourth chart).
Housing is likely to continue to be under intense pressure as near-record-high prices and elevated mortgage rates reduce affordability and push more and more buyers out of the market.
••••
About the Author: Robert Hughes joined AIER in 2013 following more than 25 years in economic and financial markets research on Wall Street. Bob was formerly the head of Global Equity Strategy for Brown Brothers Harriman, where he developed equity investment strategy combining top-down macro analysis with bottom-up fundamentals.
Prior to BBH, Bob was a Senior Equity Strategist for State Street Global Markets, Senior Economic Strategist with Prudential Equity Group and Senior Economist and Financial Markets Analyst for Citicorp Investment Services. Bob has a MA in economics from Fordham University and a BS in business from Lehigh University.
••••
The above article (Existing Home Sales Continue to Collapse) was originally created and published by the AMERICAN INSTITUTE for ECONOMIC RESEARCH (AIER) and is republished here with permission and attribution to author Robert Hughes and aier.org.
••••
Related article:
The 5 US Cities With Highest Inflation

••••
Click on the image below to visit site:

••••

••••
Stay tuned to …

••••
The Liberty Beacon Project is now expanding at a near exponential rate, and for this we are grateful and excited! But we must also be practical. For 7 years we have not asked for any donations, and have built this project with our own funds as we grew. We are now experiencing ever increasing growing pains due to the large number of websites and projects we represent. So we have just installed donation buttons on our websites and ask that you consider this when you visit them. Nothing is too small. We thank you for all your support and your considerations … (TLB)
••••
Comment Policy: As a privately owned web site, we reserve the right to remove comments that contain spam, advertising, vulgarity, threats of violence, racism, or personal/abusive attacks on other users. This also applies to trolling, the use of more than one alias, or just intentional mischief. Enforcement of this policy is at the discretion of this websites administrators. Repeat offenders may be blocked or permanently banned without prior warning.
••••
Disclaimer: TLB websites contain copyrighted material the use of which has not always been specifically authorized by the copyright owner. We are making such material available to our readers under the provisions of “fair use” in an effort to advance a better understanding of political, health, economic and social issues. The material on this site is distributed without profit to those who have expressed a prior interest in receiving it for research and educational purposes. If you wish to use copyrighted material for purposes other than “fair use” you must request permission from the copyright owner.
••••
Disclaimer: The information and opinions shared are for informational purposes only including, but not limited to, text, graphics, images and other material are not intended as medical advice or instruction. Nothing mentioned is intended to be a substitute for professional medical advice, diagnosis or treatment.


Leave a Reply