BREAKING: 51 Million-Person Study Finds COVID-19 “Vaccines” Increase Risk of Respiratory Infections by up to 559%
Landmark study of the entire South Korean population uncovers a VAIDS signal — a dose-dependent rise in the common cold, upper-respiratory infections, pneumonia, and tuberculosis among the vaccinated.
NICOLAS HULSCHER MPH
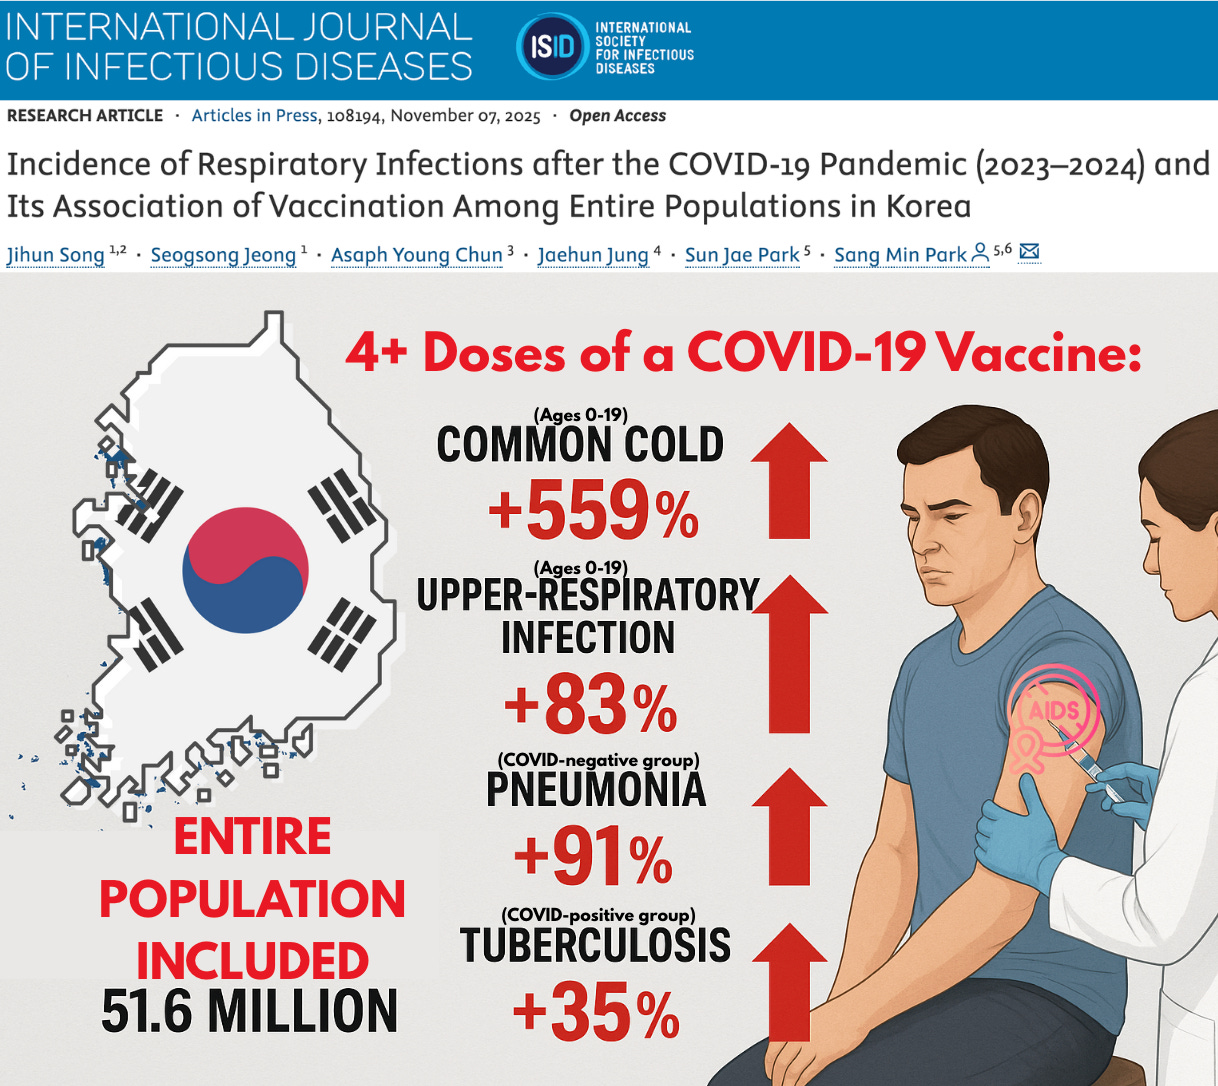
An enormous landmark study published in the International Journal of Infectious Diseases, covering every single resident in South Korea — all 51.6 million people — has delivered a striking population-level signal suggestive of vaccine-acquired immunodeficiency syndrome (VAIDS).
This massive dataset shows a consistent dose-dependent pattern: the more COVID-19 “vaccines” a person received, the higher their risk of developing the common cold and upper-respiratory infections. Increases in pneumonia and tuberculosis were identified in stratified analyses by age and infection status. Children ages 0-19 suffered the most.

Study Overview
- Population: Entire national cohort of South Korea (N = 51,645,564).
- Analytic cohort: 39,447,030 individuals with complete vaccination + infection records.
- Observation period: June 1 2023 – September 30 2024.
- Exposure: Total number of COVID-19 doses.
- Outcomes: Seven major respiratory diseases — upper-respiratory infection (URI), pneumonia, influenza-like illness (ILI), common cold, scarlet fever, pertussis, and tuberculosis.
- Covariate adjustments: age, sex, income level, Charlson comorbidity index, prior COVID-19 infection and severity, epidemic phase, and time since last vaccination.
Critical note: the “unvaccinated” reference group included individuals who had received one dose, inflating its infection rate and making the true vaccine-associated risk likely far higher than reported.
Common Cold
Children (ages 0–19) showed the strongest dose-response pattern:
- After the second dose, risk increased by 299 % (aHR 3.99 [3.78–4.21]).
- After the third dose, risk increased by 391 % (aHR 4.91 [4.62–5.22]).
- After the fourth dose or more, risk increased by 559 % (aHR 6.59 [6.00–7.23]).
Older adults (≥ 65 years) followed the same trend:
- Second dose → +9 % (aHR 1.09 [1.06–1.12]).
- Third dose → +33 % (aHR 1.33 [1.29–1.37]).
- Fourth or more doses → +58 % (aHR 1.58 [1.53–1.64]).
Among COVID-positive participants, the same pattern held:
- Second dose → +5 % (aHR 1.05 [1.03–1.06]);
- Third dose → +12 % (aHR 1.12 [1.10–1.14]);
- Fourth or more doses → +36 % (aHR 1.36 [1.34–1.39]).
Even in the pooled population-wide model, common cold incidence rose sharply with each additional dose (aHR 1.23 [1.21–1.25] after the third dose and 1.65 [1.56–1.75] after the fourth or more), confirming the trend across the entire cohort.
Interpretation: Across every analytic layer—pooled, pediatric, geriatric, and COVID-positive—common-cold incidence climbed steadily from dose 2 through dose 4+, showing a clear, monotonic relationship between cumulative vaccination and ordinary viral infection risk.
Upper-Respiratory Tract Infections
Children (0–19 yrs):
- Second dose → +62 % (aHR 1.62 [1.58–1.66]).
- Third dose → +67 % (aHR 1.67 [1.62–1.71]).
- Fourth or more doses → +83 % (aHR 1.83 [1.75–1.92]).
Older adults (≥ 65 yrs):
- Second dose → +7 % (aHR 1.07 [1.06–1.09]).
- Third dose → +32 % (aHR 1.32 [1.30–1.34]).
- Fourth or more doses → +57 % (aHR 1.57 [1.54–1.59]).
COVID-positive subgroup:
- Second dose → +2 % (aHR 1.02 [1.01–1.03]);
- Third dose → +12 % (aHR 1.12 [1.11–1.13]);
- Fourth or more doses → +32 % (aHR 1.32 [1.30–1.34]).
The pooled model also showed a consistent upward trend—aHR 1.14 after the second dose and 1.48 after the third—indicating that the dose-dependent rise in upper-respiratory infection risk persists even without stratification.
Interpretation: the rise was consistent across all groups and persisted even after adjustment for age, sex, income level, comorbidities, prior infection severity, infection phase, and time since last vaccination.
Tuberculosis
- General population: overall aHRs hovered near 1.0 (no significant change) across all dose groups.
- COVID-positive subset: clear upward trend with dose number:
- Second dose → aHR 1.24 (1.01–1.52) (+24 % risk).
- Fourth or more doses → aHR 1.35 (1.02–1.77) (+35 % risk).
Interpretation: a measurable increase in post-infection or reactivation tuberculosis among those previously infected with SARS-CoV-2 who went on to receive multiple boosters.
Pneumonia
Among COVID-negative participants, pneumonia incidence rose consistently with additional vaccine doses:
- Second dose → +34 % (aHR 1.34 [1.31–1.38])
- Fourth or more doses → +91 % (aHR 1.91 [1.84–1.99])
Interpretation: This clear dose-response pattern suggests impaired respiratory defense or susceptibility to secondary bacterial infection following repeated mRNA exposure.
Influenza-Like Illness (ILI) and Pertussis — the “Protective” Mirage
Regression models appeared to show lower adjusted hazard ratios for these two conditions—approximately 0.55 for ILI and 0.06 for pertussis after the fourth or later dose—which would suggest a protective effect.
In context, however, these apparent reductions are almost certainly statistical artifacts driven by healthy-user bias, diagnostic-coding overlap, and case misclassification. Many mild respiratory infections that might have been coded as influenza-like illness or pertussis before 2020 were likely recorded as “COVID-19” during the post-vaccine era, artificially deflating their apparent incidence in vaccinated groups.
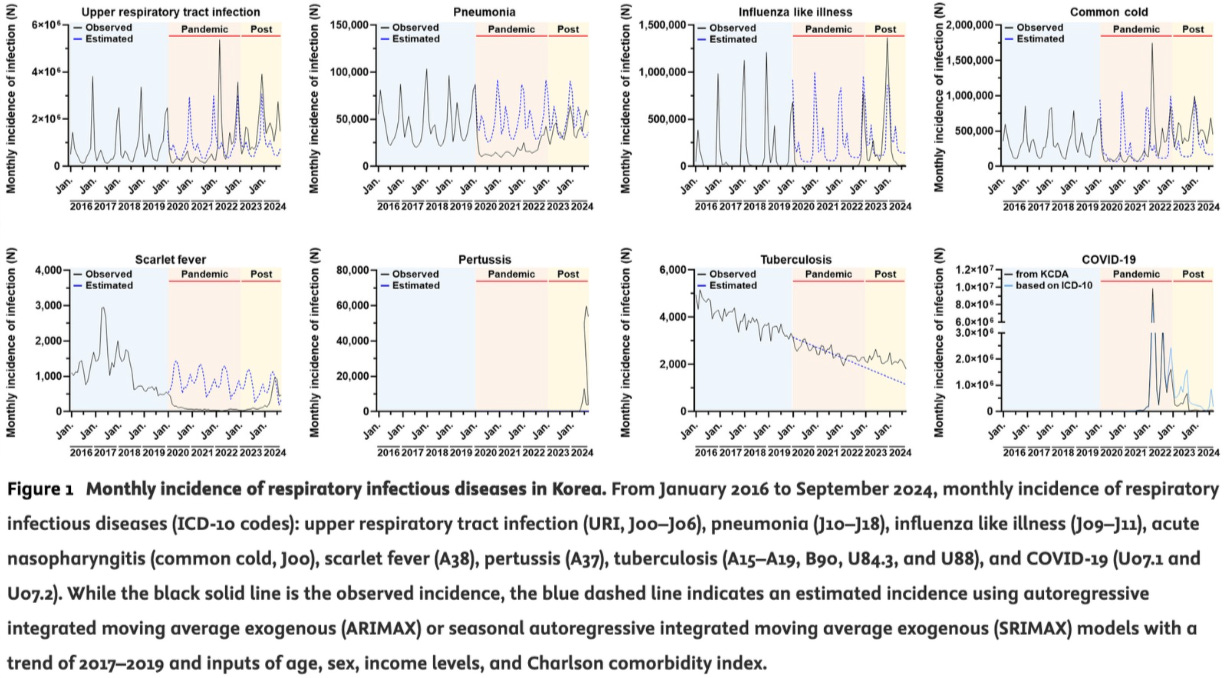
Crucially, the study’s national ARIMAX time-series revealed a 46-fold surge in confirmed pertussis cases across Korea during 2023, directly contradicting any notion of real-world protection.

When both the main and supplementary analyses are considered together, the dose-dependent increases are clear for the common cold and upper-respiratory infections across nearly all age and infection strata, with smaller but directionally similar trends for pneumonia and tuberculosis. From the second dose onward, risk ratios rise almost linearly through the fourth and higher doses, revealing a consistent pattern of heightened susceptibility to non-COVID respiratory infections.
While the pooled models already showed increases for upper-respiratory infections and the common cold, the full extent of risk—including the rises in pneumonia and tuberculosis—only becomes clear in the stratified analyses presented in the supplementary tables. By averaging across all ages and infection groups, the main text effectively diluted these signals—creating the impression of neutrality.
This pattern represents a serious population-level signal suggestive of VAIDS. Clinically, such immune dysregulation may present as a heightened incidence of upper respiratory infections and common colds, in clear dose-dependent correlation with repeated mRNA vaccination.
We are now advancing a landmark investigation into VAIDS using thousands of real-world patient records to evaluate long-term immune function across four key exposure groups—vaccinated/infected, vaccinated/uninfected, unvaccinated/infected, and unvaccinated/uninfected controls. These data allow precise comparison of lymphocyte profiles, antibody class switching, and T-cell exhaustion markers to determine how repeated mRNA vaccination and SARS-CoV-2 infection have reshaped human immunity. Preliminary signals point to immune exhaustion, IgG4 dominance, and secondary immunodeficiency, consistent with the observed surge in chronic infections and dose-dependent vulnerability to common respiratory illness.
You can support that effort here.
BREAKING: We’ve Obtained Data That Could Decommission mRNA Once and for All
by Nicolas Hulscher, MPH
CONCLUSION
Across an entire national dataset, each additional COVID-19 “vaccine” dose corresponded to a higher probability of non-COVID respiratory infection — most severely among children.
Because the “control” group included single-dose recipients, the true increase relative to the completely unvaccinated population is likely even greater than reported.
This study reveals that COVID-19 “vaccines” have eroded immune function across an entire country — and likely the entire globe.
Source
Featured image source, child: https://www.drmayankshukla.com/top-7-childhood-respiratory-diseases/
Featured image source, x-rays: https://www.innovativemri.com/2024/04/12/decoding-chest-x-rays-understanding-the-basics-of-radiological-imaging/
************
Published to The Liberty Beacon from EuropeReloaded.com

![]()
••••
The Liberty Beacon Project is now expanding at a near exponential rate, and for this we are grateful and excited! But we must also be practical. For 7 years we have not asked for any donations, and have built this project with our own funds as we grew. We are now experiencing ever increasing growing pains due to the large number of websites and projects we represent. So we have just installed donation buttons on our websites and ask that you consider this when you visit them. Nothing is too small. We thank you for all your support and your considerations … (TLB)
••••
Comment Policy: As a privately owned web site, we reserve the right to remove comments that contain spam, advertising, vulgarity, threats of violence, racism, or personal/abusive attacks on other users. This also applies to trolling, the use of more than one alias, or just intentional mischief. Enforcement of this policy is at the discretion of this websites administrators. Repeat offenders may be blocked or permanently banned without prior warning.
••••
Disclaimer: TLB websites contain copyrighted material the use of which has not always been specifically authorized by the copyright owner. We are making such material available to our readers under the provisions of “fair use” in an effort to advance a better understanding of political, health, economic and social issues. The material on this site is distributed without profit to those who have expressed a prior interest in receiving it for research and educational purposes. If you wish to use copyrighted material for purposes other than “fair use” you must request permission from the copyright owner.
••••
Disclaimer: The information and opinions shared are for informational purposes only including, but not limited to, text, graphics, images and other material are not intended as medical advice or instruction. Nothing mentioned is intended to be a substitute for professional medical advice, diagnosis or treatment.


Leave a Reply