

Do These Money Supply Charts Portend Hyperinflation?
By: Thomas L. Hogan
The Federal Reserve responded to the 2020 coronavirus outbreak and lockdowns with an unprecedented expansion of the money supply. In many cases, overly expansionary monetary policy has historically led to high rates of inflation and economic collapse. Will the United States experience the same fate of high inflation and economic collapse?
Explosion of the Money Supply
The economic downturn in the first half of 2020 was massive, as was the Fed’s response. US economic production, measured as real gross domestic product (GDP), fell by an annualized rate of 31.4% in the second quarter, the fastest ever recorded. The Fed quickly took action by cutting its interest rate targets to almost zero and by greatly expanding the supply of base money.
These factors led to a huge jump in the broader money supply. Figure 1 shows the 12-month changes in the M2 since 1982. In 2020, M2 increased by almost $4 trillion, by far the largest expansion in US history.

Some economic forecasters predict this unparalleled money expansion will lead to inflation and asset bubbles. Indeed, rapid monetary expansions have led to hyperinflation and economic collapse in a number of countries. Many believe the Fed’s overly expansive policies created asset price bubbles in the United States in the 1920s, 1990s, and early 2000s.
However, similar claims following the 2008 financial crisis were eventually proven false. Instead of high inflation and price bubbles, the economy experienced a decade of low inflation and subpar economic growth. Perhaps these lesser evils are the more likely outcome of our current predicament.
Where’s the Inflation?
Despite a massive increase in the money supply, market measures of expected inflation remain relatively mild. Figure 2 shows the financial markets’ predictions of the average rates of inflation expected over the coming 5 years, measured as the spread between the yields on 5-year US Treasuries and Treasury Inflation Protected Securities (TIPS). Inflation expectations fell in March and slowly recovered over the summer, reaching 1.95% by the end of 2020. These market rates indicate that high inflation is not coming soon, at least not in the next 5 years.

Why hasn’t the massive monetary expansion boosted inflation expectations? Let’s look at changes in the components of M2 and discuss why they might or might not lead to higher expected inflation.
What’s Driving Changes in the Money Supply?
Figure 3 shows the levels of M2 and its major components from the start of 2015 to the end of 2020. There are two things to notice about in the blue line representing M2. First, the increase in the level of M2 is much less dramatic than the change in M2 shown in Figure 1. Even though change in 2020 is unprecedented historically, it appears much smaller relative to the current total quantity of M2. Second, we see that most of the 2020 increase occurs in March and April. Since April, the growth rate has been only slightly higher than the pre-2020 average.

Figure 3 also shows the major components of M2: currency, bank deposits, and retail money market funds. It appears that the change in M2 is almost completely driven by the increase in deposits. Currency and retail money funds show similar patterns but on much smaller scales.
This, of course, begs the question: What is driving the increase in deposits?
To answer this question, let’s have a closer look at the Fed’s monetary policies. The Fed has two main tools for influencing the money supply: targeting interest rates, mostly through the interest it pays on bank reserves, and the purchase and sale of securities, known as “open market operations.” These two tools, however, can have very different effects on the money supply and the financial system.
When it buys bonds from the open market, the Fed injects money into the financial system. In the past, the Fed also used this tool to push interest rates up or down. Since 2008, however, the rate of interest on reserves has become the Fed’s main tool for influencing interest rates, while open market operations are used to add or remove money from the banking system.
Open Market Operations
Figure 4 shows the Fed’s securities holdings from 2015 through 2020, as well as total deposits in the banking system and the M2 measure of the money supply. The Fed’s open market purchases appear to be the main driver of the expansion of deposits and the money supply.
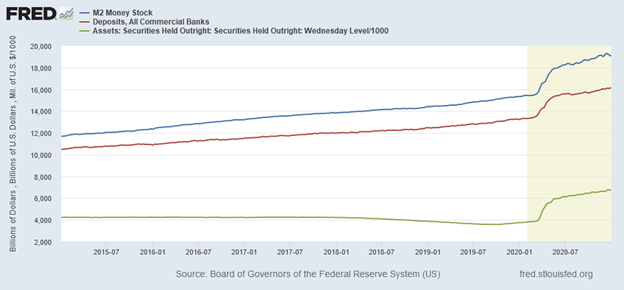
Deposits and M2 were growing steadily through early 2020, while Fed securities holdings were stable and actually falling in 2018 and 2019. During the economic downturn in March and April of 2020, the Fed began its massive monetary expansion by purchasing $2 trillion in Treasuries and mortgage-backed securities. Since then, it has continued its open market purchases but at a slower pace of $160 billion per month. The Fed’s purchases account for almost all of the increase in deposits and most of the increase in M2 during 2020.
Interest Rates and Bank Lending
While open market operations do add money directly to the banking system, the Fed’s interest rate policies normally have larger effects on the money supply due to the money multiplier effect. Reducing interest rates makes it more profitable for banks to lend. New loans increase the bank’s total assets and also create new money for the borrowers, which increases total deposits and the money supply. When this new money is spent it creates deposits at another bank which it in turn can use to create new loans. This process is repeated, which “multiplies” the effect of new deposits throughout the banking system.
Historically, the money multiplier caused the total increase in the money supply to be much larger than the direct monetary injection from the Fed’s open market purchases. However, that has not been the case in 2020. Figure 5 shows M2 and the Fed’s securities holdings since the start of 2015 as well as total bank credit, which includes all lending such as home mortgages, business loans, and credit cards. Bank credit does show a modest bump in March of 2020, but it remains mostly flat thereafter. The March increase was likely from borrowing by businesses that needed cash to survive the lockdown period rather than supporting growth or expansion.

Why hasn’t the increase in deposits been accompanied by an increase in lending? One potential explanation is that demand for loans has been low, but evidence for this theory is mixed at best. Demand for commercial and industrial as well as construction and commercial real estate loans remains depressed as the economic recovery seems to have stalled. This problem is largely concentrated in states with more serious lockdowns and business restrictions, while the economies of states with fewer restrictions have largely recovered. Demand for auto loans and credit cards fell during the summer but have since rebounded. But demand for home mortgages is up and new home sales actually spiked during the summer.
The bigger problem may be the limited supply of loans. Banks are hesitant to lend because of economic uncertainty but also because the Fed is paying them not to lend. When the Fed pays interest on banks’ excess reserves, it gives banks the incentive to hold more reserves and make fewer loans. The higher the rate it pays on reserves (relative to the rate on short-term risk-free securities), the less banks are likely to lend.
Following the 2008 financial crisis, the Fed used the rate of interest on reserves to sterilize its quantitative easing (QE) purchases. From 2008 to 2014, the Fed purchased more than $3.5 trillion in Treasuries and mortgage-backed securities. Rather than stimulating excess production and inflation as many economists expected, the high rates of interest on reserves caused these funds to be absorbed by banks as excess reserves. This had the benefit of preventing excessive inflation, but it also slowed the rate of GDP growth, which averaged just 2.2%, a full percentage point below the US post-war average.
Can the Fed Do it Again, or Is Inflation Inevitable?
Given these enormous expansions of the money supply, some might believe that inflation is inevitable. Recent history indicates it is not. After trillions of dollars in QE from 2008 to 2014, the Fed was able not only to prevent runaway inflation but also to shrink its balance sheet over time.
Figure 6 shows the Fed’s balance sheet from 2003 through the end of 2020. The Fed grew massively from late 2008 through 2014 and again in 2020, but its total assets did stabilize and then decline from 2014 through late 2019. From December 2017 to September 2019, the balance sheet declined by $700 billion, about 15.5%. This was done not through the traditional method of selling securities but simply by allowing some of its bond holdings to mature, which slowly pared down the size of its balance sheet.

Will the Fed be able to control future inflation and shrink its balance sheet back to a reasonable size? It has the tools to accomplish this goal by paying higher interest on reserves. If inflation picks up, the Fed can limit the damage by simply raising interest rates.
But no one knows for sure if Fed officials will choose to do so. Over the past decade, constraining inflation came at the cost of reducing bank lending and economic growth. The Fed now faces a similar dilemma but with an even larger balance sheet than in 2014. Will Fed officials have the political will to raise interest rates and limit inflation before the economy reaches “full employment,” the current political rally cry?
There are also other economic factors and problems of political economy. The United States could experience a double-dip recession, in which case the Fed might increase its open market purchases. Having already abandoned the promises by prior Fed chairs to avoid credit allocation, future Fed chairs may face renewed political pressure to bail out nonbank companies and state and local governments. Such actions would further expand the Fed’s balance sheet, making it more difficult to reduce its size and control inflation.
Financial markets indicators suggest that high inflation is not likely. Even with a very large balance sheet, the Fed has proven that it can control inflation by paying high rates of interest on bank reserves. Whether Fed officials choose to do so is the open question.
••••
About the Author: Thomas L. Hogan, Ph.D., is a senior research fellow at AIER. He was formerly the chief economist for the U.S. Senate Committee on Banking, Housing and Urban Affairs. His research interests include banking regulation and monetary policy.
••••
The above article (Do These Money Supply Charts Portend Hyperinflation?) was originally created and published by the AMERICAN INSTITUTE for ECONOMIC RESEARCH and is republished here with permission and attribution to the author Thomas L. Hogan and aier.org.
••••

••••
Stay tuned to …

••••
The Liberty Beacon Project is now expanding at a near exponential rate, and for this we are grateful and excited! But we must also be practical. For 7 years we have not asked for any donations, and have built this project with our own funds as we grew. We are now experiencing ever increasing growing pains due to the large number of websites and projects we represent. So we have just installed donation buttons on our websites and ask that you consider this when you visit them. Nothing is too small. We thank you for all your support and your considerations … (TLB)
••••
Comment Policy: As a privately owned web site, we reserve the right to remove comments that contain spam, advertising, vulgarity, threats of violence, racism, or personal/abusive attacks on other users. This also applies to trolling, the use of more than one alias, or just intentional mischief. Enforcement of this policy is at the discretion of this websites administrators. Repeat offenders may be blocked or permanently banned without prior warning.
••••
Disclaimer: TLB websites contain copyrighted material the use of which has not always been specifically authorized by the copyright owner. We are making such material available to our readers under the provisions of “fair use” in an effort to advance a better understanding of political, health, economic and social issues. The material on this site is distributed without profit to those who have expressed a prior interest in receiving it for research and educational purposes. If you wish to use copyrighted material for purposes other than “fair use” you must request permission from the copyright owner.
••••
Disclaimer: The information and opinions shared are for informational purposes only including, but not limited to, text, graphics, images and other material are not intended as medical advice or instruction. Nothing mentioned is intended to be a substitute for professional medical advice, diagnosis or treatment.


Leave a Reply