

US Inflation: How Much Have Prices Increased In 2022?
![]()
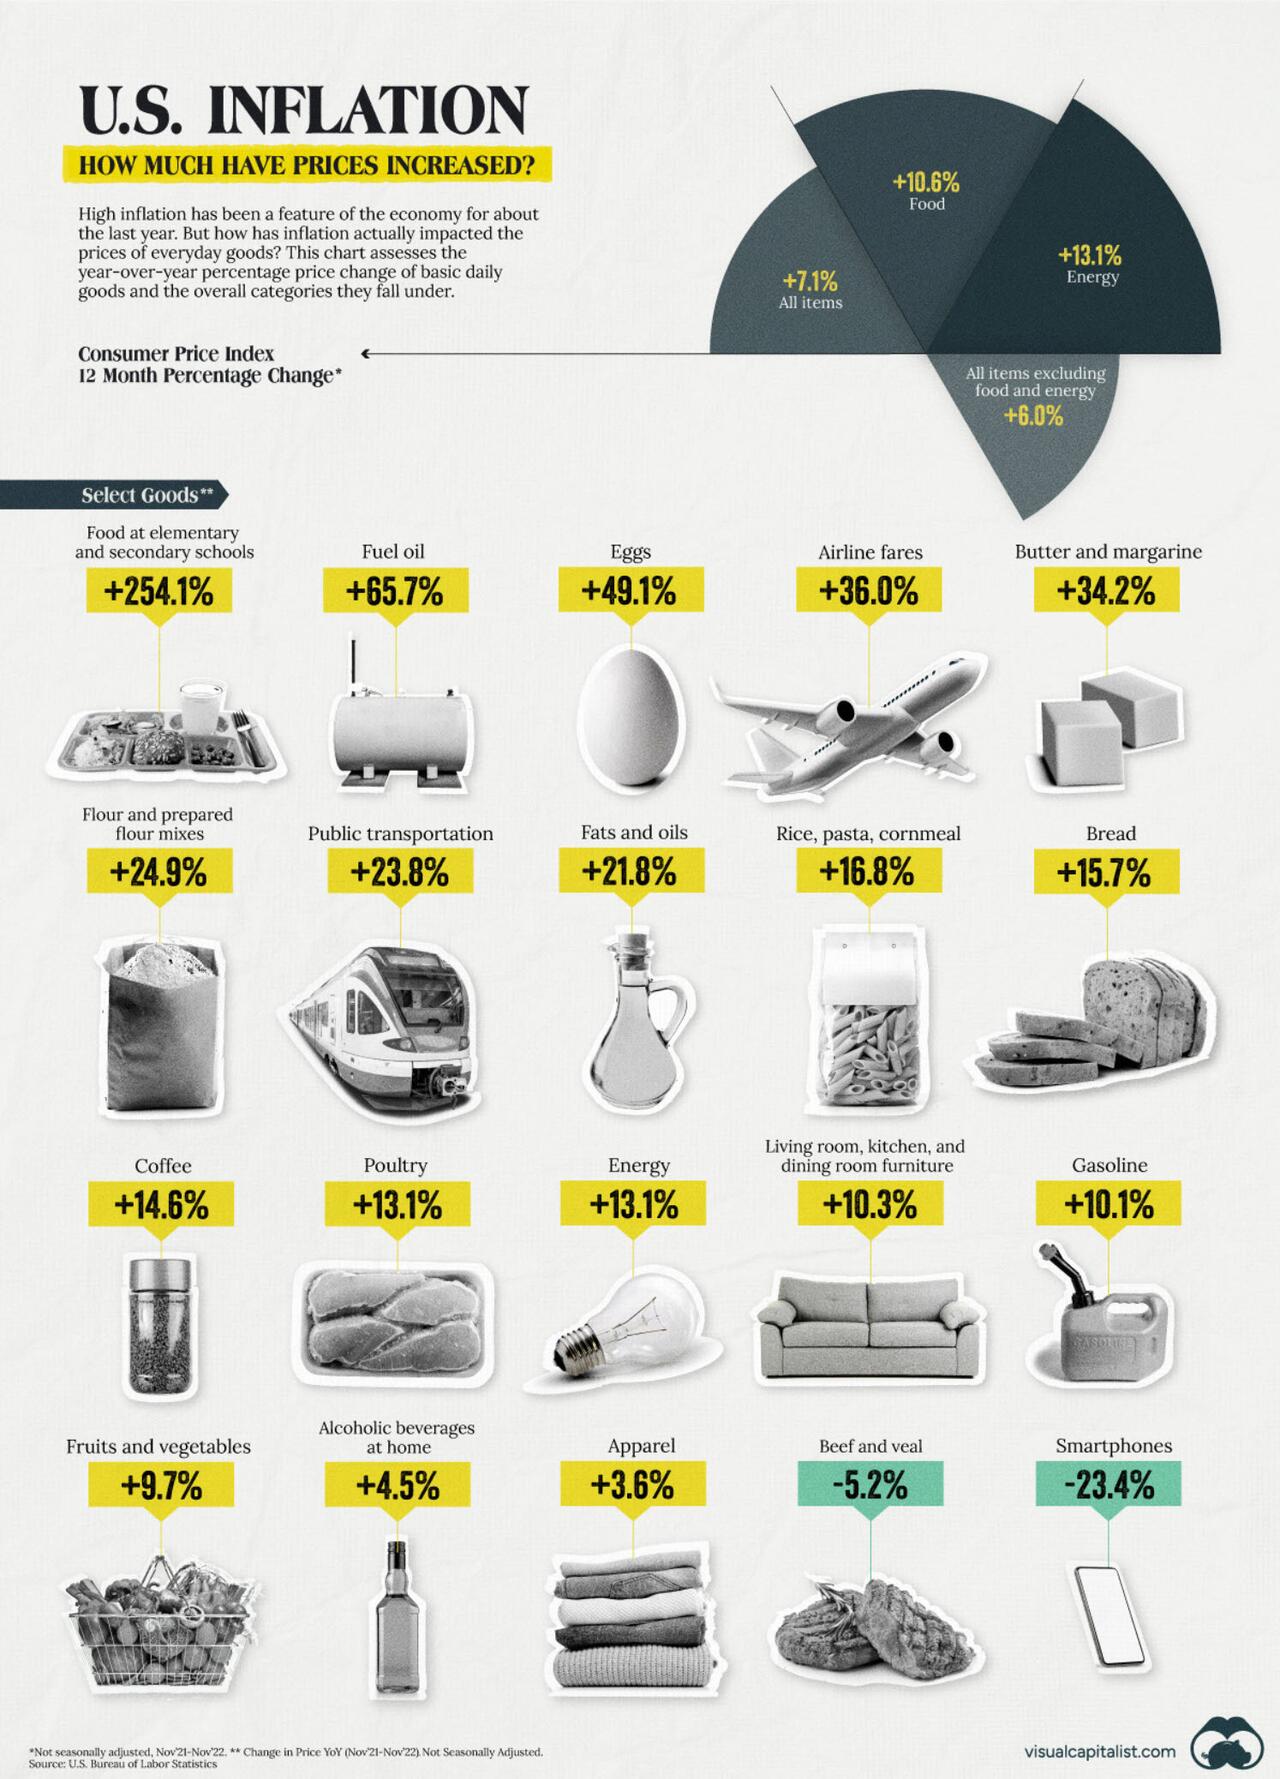
Inflation has been top of mind over the last year, looming over every aspect of the economy. But how has inflation actually impacted the prices of everyday goods like bread and butter or gas and public transportation?
In this infographic, Visual Capitalist’s Avery Koop and Bhabna Banerjee showcase select items and how inflation has impacted the price year-over-year. Additionally, we’ve charted the overall price increases across the overarching goods categories, using data from the U.S. Bureau of Labor Statistics (BLS).
Note: These numbers are assessed using the Consumer Price Index (CPI) for all Urban Consumers (CPI-U), using the U. S. city average by detailed expenditure category.
How Much has the Cost of Goods Gone Up?
Inflation has caused the cost of many goods to increase significantly compared to last year. The most dramatically affected item is elementary school lunches, a cost in the U.S. that is already unaffordable for many families.
Here’s a look at every single reported good’s change in price from last year:
| Item | Unadjusted Change YoY (Nov 2021 – Nov 2022) |
|---|---|
| Food at elementary and secondary schools | +254.1% |
| Food at employee sites and schools | +110.1% |
| Fuel oil | +65.7% |
| Eggs | +49.1% |
| Margarine | +47.4% |
| Other motor fuels | +43.3% |
| Fuel oil and other fuels | +41.7% |
| Airline fares | +36.0% |
| Butter and margarine | +34.2% |
| Butter | +27.0% |
| Flour and prepared flour mixes | +24.9% |
| Public transportation | +23.8% |
| Other dairy and related products | +22.4% |
| Fats and oils | +21.8% |
| Canned fruits | +20.9% |
| Crackers, bread, and cracker products | +19.9% |
| Salad dressing | +19.9% |
| Lettuce | +19.8% |
| Motor oil, coolant, and fluids | +19.6% |
| Frozen and refrigerated bakery products, pies, tarts, turnovers | +19.4% |
| Cookies | +19.2% |
| Lunchmeat | +18.4% |
| Canned fruits and vegetables | +18.4% |
| Frozen vegetables | +18.3% |
| Other uncooked poultry including turkey | +17.9% |
| Cakes, cupcakes, and cookies | +17.6% |
| Ice cream and related products | +17.5% |
| Rice, pasta, cornmeal | +16.8% |
| Cereals and cereal products | +16.6% |
| Other bakery products | +16.5% |
| Cereals and bakery products | +16.4% |
| Dairy and related products | +16.4% |
| Bakery products | +16.3% |
| Other meats | +16.2% |
| Potatoes | +16.2% |
| Canned vegetables | +16.2% |
| Olives, pickles, relishes | +16.1% |
| Processed fruits and vegetables | +15.8% |
| Bread | +15.7% |
| Pet food | +15.7% |
| Fresh milk other than whole | +15.6% |
| White bread | +15.5% |
| Bread other than white | +15.5% |
| Utility (piped) gas service | +15.5% |
| Roasted coffee | +15.2% |
| Other fats and oils including peanut butter | +15.2% |
| Soups | +15.0% |
| Motor vehicle repair | +15.0% |
| Frozen fruits and vegetables | +14.9% |
| Fresh biscuits, rolls, muffins | +14.8% |
| Milk | +14.7% |
| Coffee | +14.6% |
| Other miscellaneous foods | +14.6% |
| Fresh cakes and cupcakes | +14.4% |
| Stationery, stationery supplies, gift wrap | +14.3% |
| Energy services | +14.2% |
| Transportation services | +14.2% |
| Rice | +14.1% |
| Sugar and sugar substitutes | +14.1% |
| Household paper products | +14.1% |
| Apparel services other than laundry and dry cleaning | +14.1% |
| Frozen and freeze dried prepared foods | +14.0% |
| Instant coffee | +13.9% |
| Other food at home | +13.9% |
| Delivery services | +13.8% |
| Fresh whole chicken | +13.7% |
| Beverage materials including coffee and tea | +13.7% |
| Sauces and gravies | +13.7% |
| Electricity | +13.7% |
| Vehicle accessories other than tires | +13.7% |
| Health insurance | +13.5% |
| Frankfurters | +13.4% |
| Motor vehicle insurance | +13.4% |
| Breakfast cereal | +13.3% |
| Nonalcoholic beverages and beverage materials | +13.2% |
| Nonfrozen noncarbonated juices and drinks | +13.2% |
| Poultry | +13.1% |
| Fresh whole milk | +13.1% |
| Sugar and sweets | +13.1% |
| Energy | +13.1% |
| Pets and pet products | +13.0% |
| Juices and nonalcoholic drinks | +12.9% |
| Candy and chewing gum | +12.9% |
| Other foods | +12.9% |
| Carbonated drinks | +12.8% |
| Tools, hardware and supplies | +12.8% |
| Other sweets | +12.7% |
| Cheese and related products | +12.4% |
| Oranges, including tangerines | +12.4% |
| Gasoline, unleaded premium | +12.4% |
| Housekeeping supplies | +12.4% |
| Motor vehicle body work | +12.4% |
| Energy commodities | +12.2% |
| Other beverage materials including tea | +12.1% |
| Food at home | +12.0% |
| Chicken | +12.0% |
| Miscellaneous household products | +11.9% |
| Vehicle parts and equipment other than tires | +11.8% |
| Household cleaning products | +11.7% |
| Motor vehicle maintenance and repair | +11.7% |
| Fresh and frozen chicken parts | +11.6% |
| Motor vehicle parts and equipment | +11.6% |
| Food from vending machines and mobile vendors | +11.5% |
| Snacks | +11.1% |
| Spices, seasonings, condiments, sauces | +11.1% |
| Veterinarian services | +11.0% |
| Baby food | +10.9% |
| Pet services including veterinary | +10.9% |
| Motor fuel | +10.8% |
| Miscellaneous personal goods | +10.8% |
| Gasoline, unleaded midgrade | +10.7% |
| Food | +10.6% |
| Other processed fruits and vegetables including dried | +10.4% |
| Living room, kitchen, and dining room furniture | +10.3% |
| Tires | +10.3% |
| Floor coverings | +10.2% |
| Gasoline (all types) | +10.1% |
| Tools, hardware, outdoor equipment and supplies | +10% |
| Gasoline, unleaded regular | +9.8% |
| Fruits and vegetables | +9.7% |
| Fresh vegetables | +9.6% |
| Fresh sweetrolls, coffeecakes, doughnuts | +9.5% |
| Citrus fruits | +9.5% |
| Prepared salads | +9.5% |
| Hair, dental, shaving, and miscellaneous personal care products | +9.3% |
| Motor vehicle maintenance and servicing | +9.3% |
| Tax return preparation and other accounting fees | +9.1% |
| Full service meals and snacks | +9.0% |
| Purchase of pets, pet supplies, accessories | +8.9% |
| Video discs and other media | +8.9% |
| Frozen fish and seafood | +8.8% |
| Women’s underwear, nightwear, swimwear, and accessories | +8.6% |
| Food away from home | +8.5% |
| Dishes and flatware | +8.5% |
| Outdoor equipment and supplies | +8.4% |
| Household furnishings and supplies | +8.3% |
| Fresh fruits and vegetables | +8.0% |
| Wine away from home | +7.9% |
| Rent of primary residence | +7.9% |
| Laundry and dry cleaning services | +7.9% |
| Ham | +7.8% |
| Dried beans, peas, and lentils | +7.8% |
| New cars | +7.8% |
| Breakfast sausage and related products | +7.7% |
| Processed fish and seafood | +7.7% |
| Beer, ale, and other malt beverages at home | +7.7% |
| Ham, excluding canned | +7.6% |
| Other goods | +7.5% |
| Apples | +7.4% |
| Other fresh vegetables | +7.4% |
| Personal care products | +7.4% |
| Pet services | +7.4% |
| Admission to movies, theaters, and concerts | +7.4% |
| Frozen noncarbonated juices and drinks | +7.3% |
| Medical equipment and supplies | +7.3% |
| Rental of video discs and other media | +7.3% |
| New vehicles | +7.2% |
| Rent of shelter | +7.2% |
| New trucks | +7.1% |
| Music instruments and accessories | +7.1% |
| Alcoholic beverages away from home | +7.1% |
| Shelter | +7.1% |
| Owners’ equivalent rent of residences | +7.1% |
| Owners’ equivalent rent of primary residence | +7.1% |
| Distilled spirits away from home | +7.0% |
| Salt and other seasonings and spices | +6.9% |
| Meats, poultry, fish, and eggs | +6.8% |
| Furniture and bedding | +6.8% |
| Services less energy services | +6.8% |
| Personal care services | +6.8% |
| Haircuts and other personal care services | +6.8% |
| Limited service meals and snacks | +6.7% |
| Shelf stable fish and seafood | +6.6% |
| Fresh fruits | +6.6% |
| Beer, ale, and other malt beverages away from home | +6.6% |
| Garbage and trash collection | +6.6% |
| Fish and seafood | +6.5% |
| Indoor plants and flowers | +6.5% |
| Other personal services | +6.5% |
| Cigarettes | +6.4% |
| Dental services | +6.4% |
| Video discs and other media, including rental of video | +6.4% |
| Men’s suits, sport coats, and outerwear | +6.3% |
| Tobacco and smoking products | +6.3% |
| Miscellaneous personal services | +6.3% |
| College textbooks | +6.2% |
| Legal services | +6.2% |
| All items less food and energy | +6.0% |
| Women’s suits and separates | +5.9% |
| Clocks, lamps, and decorator items | +5.8% |
| Peanut butter | +5.7% |
| Women’s apparel | +5.7% |
| Window and floor coverings and other linens | +5.6% |
| Women’s and girls’ apparel | +5.6% |
| Other fresh fruits | +5.5% |
| Other food away from home | +5.5% |
| Other household equipment and furnishings | +5.5% |
| Newspapers and magazines | +5.5% |
| Alcoholic beverages | +5.5% |
| Tobacco products other than cigarettes | +5.5% |
| Fresh fish and seafood | +5.4% |
| Nonprescription drugs | +5.4% |
| Cosmetics, perfume, bath, nail preparations and implements | +5.4% |
| Recreation services | +5.4% |
| Financial services | +5.4% |
| Sports equipment | +5.3% |
| Educational books and supplies | +5.3% |
| Day care and preschool | +5.3% |
| Other condiments | +5.2% |
| Girls’ apparel | +5.2% |
| Jewelry and watches | +5.2% |
| Watches | +5.1% |
| Jewelry | +5.1% |
| Toys, games, hobbies and playground equipment | +5.1% |
| Club membership for shopping clubs, organizations, or participant sports fees | +5.1% |
| Other linens | +5.0% |
| Other furniture | +5.0% |
| Water and sewer and trash collection services | +5.0% |
| Fees for lessons or instructions | +5.0% |
| Funeral expenses | +4.9% |
| Alcoholic beverages at home | +4.5% |
| Nursing homes and adult day services | +4.5% |
| Water and sewerage maintenance | +4.4% |
| Domestic services | +4.4% |
| Medical care services | +4.4% |
| Photographers and photo processing | +4.4% |
| Other recreation services | +4.4% |
| Residential telephone services | +4.4% |
| Meats, poultry, and fish | +4.3% |
| Video and audio services | +4.2% |
| Postage and delivery services | +4.2% |
| Cable and satellite television service | +4.0% |
| Infants’ and toddlers’ apparel | +3.9% |
| Bananas | +3.8% |
| Propane, kerosene, and firewood | +3.8% |
| Care of invalids and elderly at home | +3.8% |
| Commodities less food and energy commodities | +3.7% |
| Services by other medical professionals | +3.7% |
| Admissions | +3.7% |
| Tomatoes | +3.6% |
| Apparel | +3.6% |
| Recreation commodities | +3.6% |
| Moving, storage, freight expense | +3.5% |
| Elementary and high school tuition and fees | +3.5% |
| Photographic equipment and supplies | +3.3% |
| Other lodging away from home including hotels and motels | +3.3% |
| Recreational reading materials | +3.2% |
| Lodging away from home | +3.2% |
| Hospital and related services | +3.2% |
| Postage | +3.2% |
| Medical care commodities | +3.1% |
| Professional services | +3.1% |
| Intracity transportation | +3.1% |
| Tuition, other school fees, and childcare | +3.1% |
| Wine at home | +3.0% |
| Outpatient hospital services | +3.0% |
| Other appliances | +2.9% |
| Hospital services | +2.9% |
| Bedroom furniture | +2.8% |
| Medicinal drugs | +2.8% |
| Housing at school, excluding board | +2.8% |
| Inpatient hospital services | +2.8% |
| Sporting goods | +2.7% |
| Men’s shirts and sweaters | +2.5% |
| Window coverings | +2.4% |
| Men’s footwear | +2.4% |
| Transportation commodities less motor fuel | +2.4% |
| Checking account and other bank services | +2.4% |
| Men’s apparel | +2.3% |
| Footwear | +2.3% |
| Boys’ and girls’ footwear | +2.3% |
| State motor vehicle registration and license fees | +2.3% |
| Bacon, breakfast sausage, and related products | +2.2% |
| Women’s footwear | +2.2% |
| Education and communication services | +2.2% |
| Photographic equipment | +2.0% |
| College tuition and fees | +2.0% |
| Prescription drugs | +1.9% |
| Recorded music and music subscriptions | +1.8% |
| Eyeglasses and eye care | +1.8% |
| Motor vehicle fees | +1.8% |
| Appliances | +1.7% |
| Distilled spirits at home | +1.7% |
| Whiskey at home | +1.7% |
| Distilled spirits, excluding whiskey, at home | +1.7% |
| Pork chops | +1.6% |
| Other intercity transportation | +1.6% |
| Men’s pants and shorts | +1.5% |
| Physicians’ services | +1.5% |
| Telephone services | +1.5% |
| Audio equipment | +1.4% |
| Other recreational goods | +1.4% |
| Internet services and electronic information providers | +1.4% |
| Men’s and boys’ apparel | +1.3% |
| Pork | +1.2% |
| Meats | +1.1% |
| Women’s dresses | +1.1% |
| Sports vehicles including bicycles | +1.1% |
| Parking fees and tolls | +1.1% |
| Technical and business school tuition and fees | +1.1% |
| Wireless telephone services(1)(2) | +1.0% |
| Sewing machines, fabric and supplies | +0.9% |
| Parking and other fees | +0.9% |
| Nonelectric cookware and tableware | +0.8% |
| Men’s underwear, nightwear, swimwear, and accessories | +0.8% |
| Toys | +0.6% |
| Tenants’ and household insurance | +0.6% |
| Intracity mass transit | +0.4% |
| Laundry equipment | +0.1% |
| Recreational books | 0.0% |
| Uncooked ground beef | -1.0% |
| Major appliances | -1.0% |
| Bacon and related products | -1.1% |
| Boys’ apparel | -1.7% |
| Computer software and accessories | -1.7% |
| Women’s outerwear | -2.0% |
| Used cars and trucks | -3.3% |
| Ship fare | -3.6% |
| Computers, peripherals, and smart home assistants | -4.4% |
| Other pork including roasts, steaks, and ribs | -5.1% |
| Beef and veal | -5.2% |
| Car and truck rental | -6.0% |
| Uncooked other beef and veal | -7.2% |
| Admission to sporting events | -7.2% |
| Uncooked beef steaks | -7.4% |
| Uncooked beef roasts | -8.1% |
| Video and audio products | -8.2% |
| Other video equipment | -9.5% |
| Education and communication commodities | -9.7% |
| Information technology commodities | -11.5% |
| Televisions | -17.0% |
| Telephone hardware, calculators, and other consumer info items | -17.9% |
| Smartphones | -23.4% |
| Household operations | – |
| Gardening and lawncare services | – |
| Repair of household items | – |
| Leased cars and trucks | – |
| All items | +7.1% |
School lunches became more expensive this year as a federal waiver program came to an end. The program had provided every school child in the country with free lunches.
After school lunches, fuel oil and eggs rank high in terms of big jumps in their prices, increasing by 66% and 49% respectively. Some other notable increases: airfares have gone up by 36%, living room, kitchen, and dining room furniture by 10.3%, and alcoholic beverages at home by 4.5%.
However, a number of goods have actually gone down in the index, including:
- Smartphones: -23%
- Televisions: -17%
- Uncooked beef roasts: -8%
- Admission to sporting events: -7%
- Car and truck rentals: -6%
Interestingly, smartphones are not actually getting cheaper, rather the BLS adjusts for products that improve rapidly in quality year-over-year. Usually, most items are identical on a year-to-year basis, but smartphones are improving in their quality, which is why their price appears to be deflating rather than inflating.

U.S. Inflation
Overall, the items in the basket of goods under the Consumer Price Index have increased by a collective 7.1% since last year, making purchasing necessary food and energy items more difficult.
Here’s another look at how each overarching category increased, between November 2021 and November 2022:
- Food: +10.6%
- Energy: +13.1%
- All other items excluding food and energy: +6.0%
Purchasing your everyday ingredients to cook with, energy to heat your home, and all other items that are standard in our everyday lives has become increasingly expensive. In an effort to counter inflation pressures, the U.S. Federal Reserve has been raising interest rates to make borrowing more difficult in order to push down demand.
Heading into 2023, many feel that a recession is on the way, and a lot of households will have to continue borrowing at higher rates to keep up with basic goods purchases. On the upside, some experts anticipate that although there will be economic downturn, it will be brief and won’t deeply impact the economy like past ones.
*********
(TLB) published this article from ZeroHedge as compiled and written by Tyler Durden
Header featured image (edited) credit: ORLANDO, FLORIDA/Shoppers wait in a check-out line at a Costco wholesale store/Getty Images
Emphasis and pictorial content added by (TLB) editors
••••

••••
Stay tuned to …

••••
The Liberty Beacon Project is now expanding at a near exponential rate, and for this we are grateful and excited! But we must also be practical. For 7 years we have not asked for any donations, and have built this project with our own funds as we grew. We are now experiencing ever increasing growing pains due to the large number of websites and projects we represent. So we have just installed donation buttons on our websites and ask that you consider this when you visit them. Nothing is too small. We thank you for all your support and your considerations … (TLB)
••••
Comment Policy: As a privately owned web site, we reserve the right to remove comments that contain spam, advertising, vulgarity, threats of violence, racism, or personal/abusive attacks on other users. This also applies to trolling, the use of more than one alias, or just intentional mischief. Enforcement of this policy is at the discretion of this websites administrators. Repeat offenders may be blocked or permanently banned without prior warning.
••••
Disclaimer: TLB websites contain copyrighted material the use of which has not always been specifically authorized by the copyright owner. We are making such material available to our readers under the provisions of “fair use” in an effort to advance a better understanding of political, health, economic and social issues. The material on this site is distributed without profit to those who have expressed a prior interest in receiving it for research and educational purposes. If you wish to use copyrighted material for purposes other than “fair use” you must request permission from the copyright owner.
••••
Disclaimer: The information and opinions shared are for informational purposes only including, but not limited to, text, graphics, images and other material are not intended as medical advice or instruction. Nothing mentioned is intended to be a substitute for professional medical advice, diagnosis or treatment.


Leave a Reply