

The Path To Full Stagflation
By Peter Earle | The American Institute for Economic Research
In an article last week, I referred to the combination of rapidly slowing US economic growth and persistently high inflation as “stagflation lite.” Despite receding from the highs of last summer, inflation remains near its highest levels in decades as disinflation (particularly in services) has recently slowed to a crawl.
Meanwhile, US economic growth has been on a downward trajectory over the past few years, including a brief recession in the middle two quarters of 2022.

What’s currently missing from the full stagflationary scenario is elevated unemployment. The Bureau of Labor Statistics reported the U-3 US unemployment rate as 3.5 percent in March 2023, which is near historic lows. Indeed, low employment has been a thorn in Fed officials’ side since they began hiking short-term rates in March of 2022. The below chart depicts the current, stagflation lite conditions: high inflation (March 2023 year-over-year headline CPI at roughly 5 percent), declining economic growth (1st quarter 2023 US GDP at 1.1 percent), and U-3 employment at 3.5 percent.
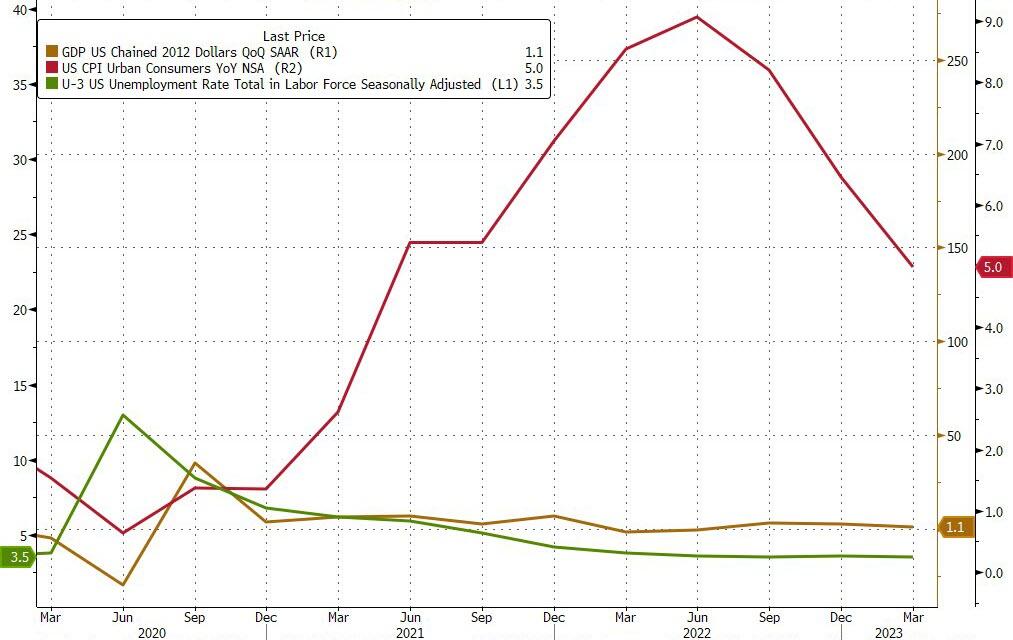
(Source: Bloomberg Finance, LP)
Could a full stagflationary episode evolve from this? It’s possible that one already is, according to two sources of data.
First, a look at unemployment data on a state-by-state basis. Tracking the 4-week, year-over-year percentage changes in initial filings for unemployment, 24 of 51 states (50 states plus Washington DC) are showing an average 10-percent or greater increase in those filings over the period from mid-March 2023 to mid-April 2023.
The ten US states with the lowest unemployment rates, as of mid-April 2023, include the following: South Dakota (1.9 percent), Nebraska (2.1 percent), North Dakota (2.1 percent), Alabama (2.3 percent), Montana (2.3 percent), New Hampshire (2.4 percent), Utah (2.4 percent), Missouri (2.5 percent), Wisconsin (2.5 percent), and Florida (2.6) percent. Below are the recent trends in initial unemployment filings in those low-unemployment-rate states.
Initial Unemployment Claims in High Employment States: South Dakota, Nebraska, Alabama, North Dakota, and Montana (April 2021 – April 2023)
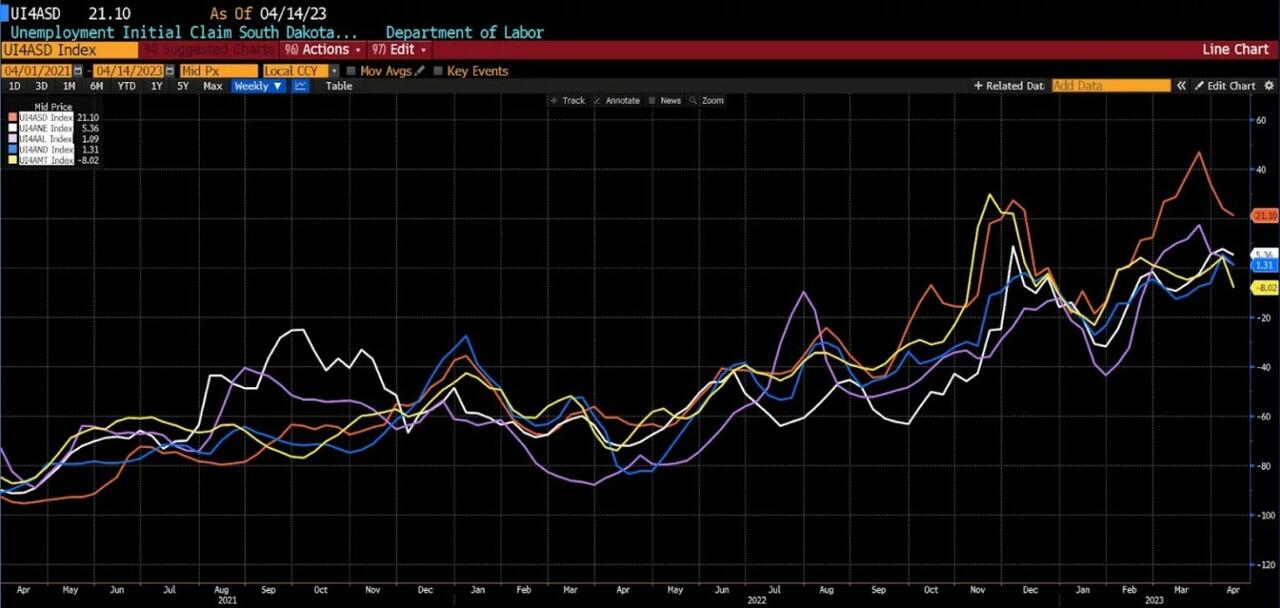
(Source: Bloomberg Finance, LP)
Initial Unemployment Claims in High Employment States: New Hampshire Utah, Missouri, Wisconsin, and Florida (April 2021 – April 2023)
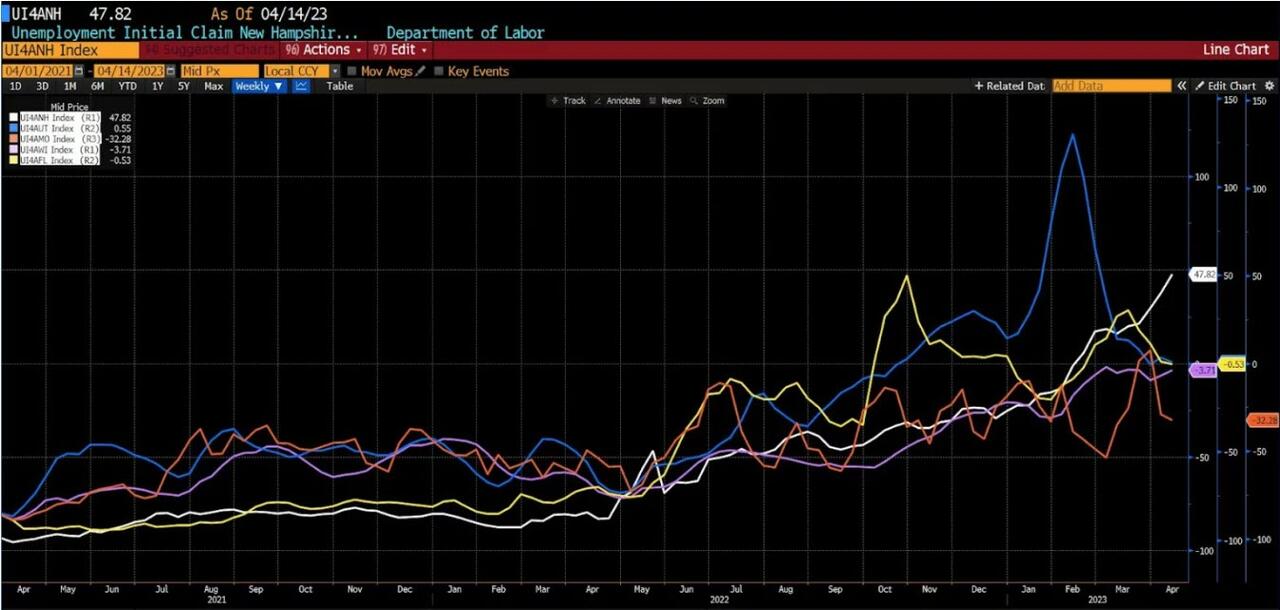
(Source: Bloomberg Finance, LP)
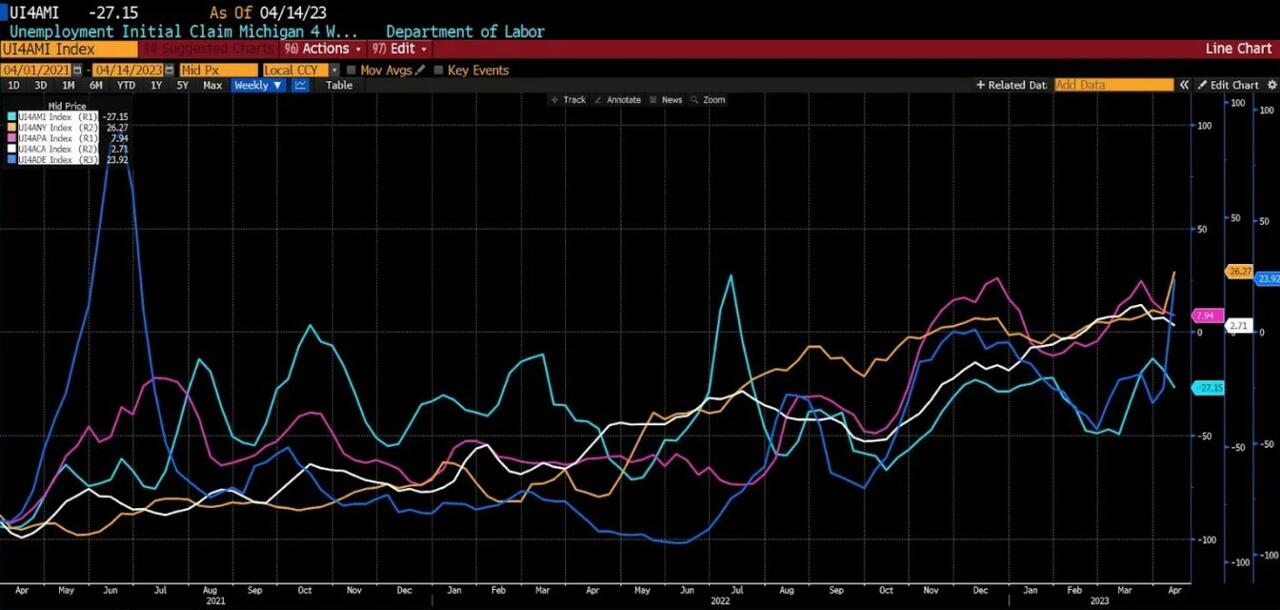
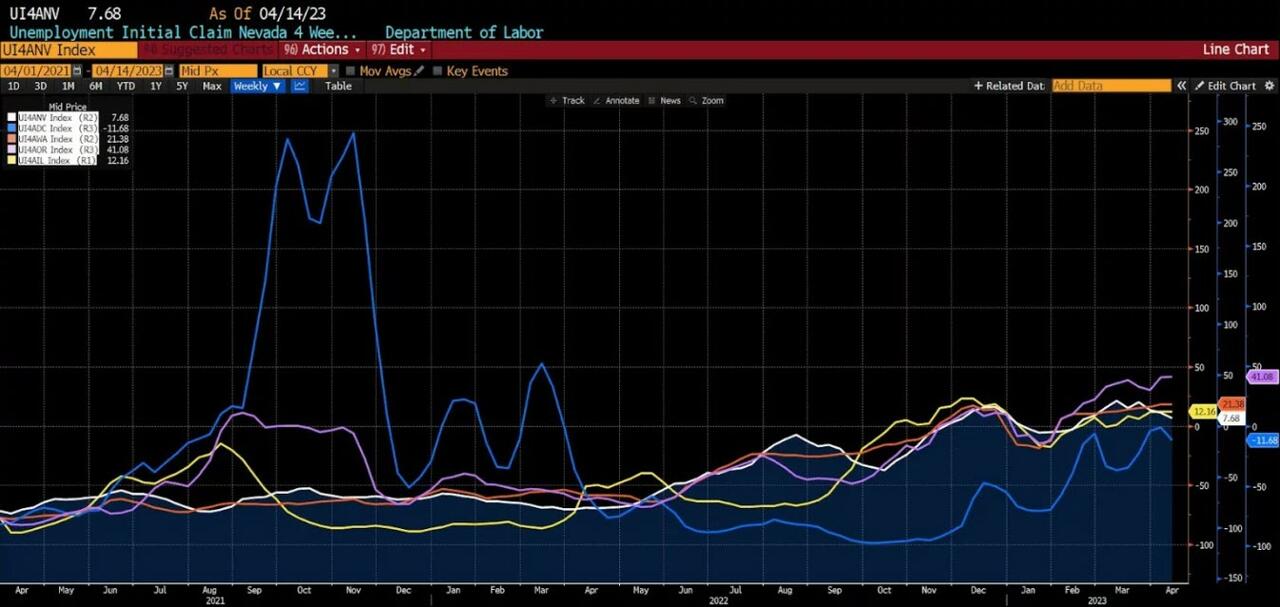
The ten US states with the highest unemployment rates (again, as of mid-April 2023) include: Michigan (4.1 percent), New York (4.1 percent), Pennsylvania (4.2 percent), California (4.4 percent), Delaware (4.4 percent), Illinois (4.4 percent), Washington (4.5 percent), District of Columbia (4.8 percent), and Nevada (5.5 percent). Below are the trends in initial unemployment claims in the highest unemployment states.
Initial Unemployment Claims in Low Employment States: Michigan, New York, Pennsylvania, California, and Delaware (April 2021 – April 2023)
(Source: Bloomberg Finance, LP)
Initial Unemployment Claims in Low Employment States: Oregon, Illinois, Washington, District of Columbia, and Nevada (April 2021 – April 2023)
(Source: Bloomberg Finance, LP)
In most of the ten US states with the lowest and highest unemployment rates, initial claims are trending both higher and at an accelerated rate over the past three to six months. This is at odds with the current publicly available federal unemployment data.
A similar progression is evident in WARN (Worker Adjustment and Retraining Notification Act of 1988) data. Generally speaking, although some states have their own versions of it, the Act requires firms with 100 or more employees to give employees at least 60 days notice of impending layoffs or facility closings. Looking at the aggregate number of jobs accounted for in recent WARN filings across 39 US states, a similar pattern to what’s happening in initial claims is unambiguously clear.
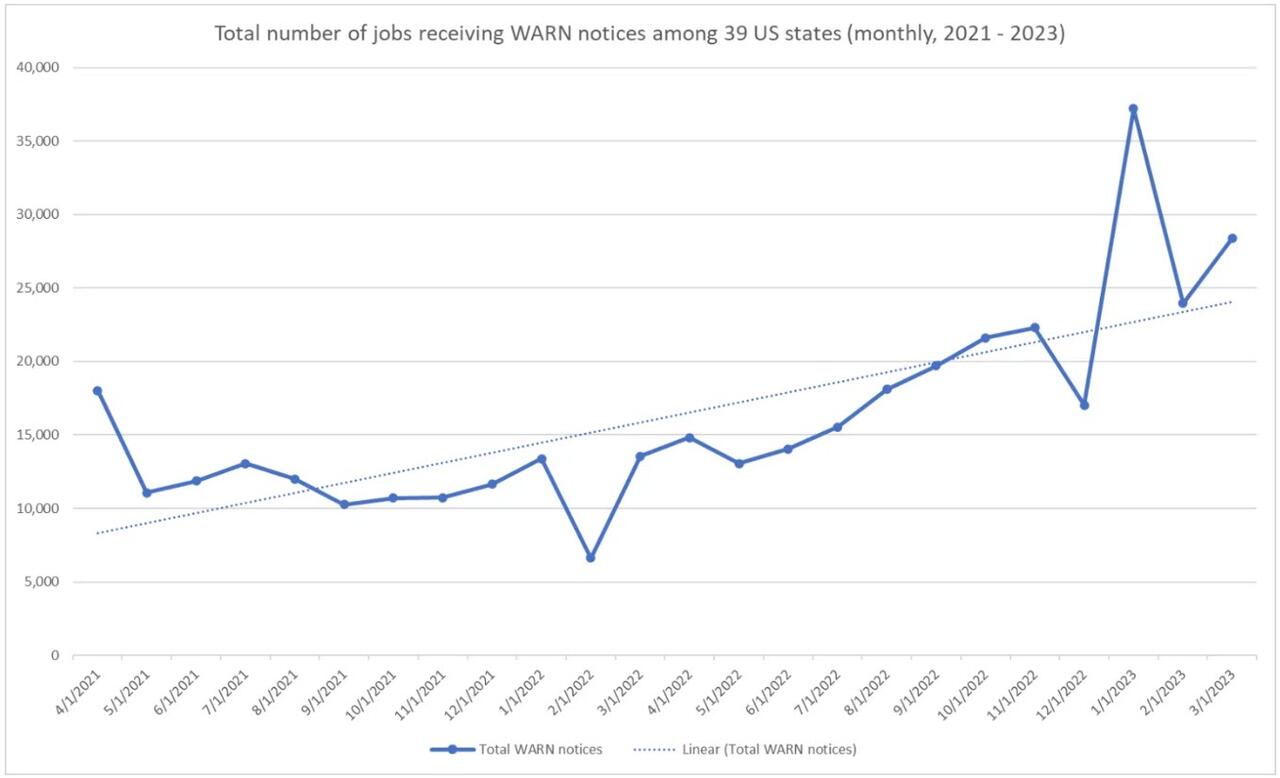
(https://www.openicpsr.org/openicpsr/)
Federal and state unemployment data draw from different sources. As depicted here, state filings provide a more comprehensive “under the hood” view of developing economic trends than that which is available and published by loftier government departments and agencies.
On the basis of both initial claims for unemployment (in both high and low employment states) and WARN filings (in 39 US states), unemployment is rising rapidly. More importantly, those increases are not currently being captured in the reports of the Bureau of Labor Statistics (BLS) or other federal sources.
With rigidly elevated inflation and shrinking output, it’s not an exceptionally daring proposition to predict that job losses will follow. And none of this necessarily anticipates job losses on par with the worst recessions of the last few decades. Should these tendencies continue, though, they would fulfill the third and currently missing criteria of an outbreak of stagflation.
Inflation could, over the remainder of this year, return to the levels the Fed seeks. Or the Fed could back away from its stated commitment to the return to a 2-percent long-run price level target, perhaps even choosing instead to lower rates in order to artificially boost employment, induce business expansion, and lift financial asset prices. In any case, the US economy looks to be pointed in a troubling direction…
A direction which, let no one forget, finds most of its nascence in reckless and politically motivated public health, fiscal, and monetary policies now three years back.
*********
(TLB) published this article By Peter Earle | The American Institute for Economic Research with our sincere appreciation for this perspective
Header featured image (edited) credit: People standing in line/org. AIER article
Emphasis added by (TLB) editors
••••

••••
Stay tuned to …

••••
The Liberty Beacon Project is now expanding at a near exponential rate, and for this we are grateful and excited! But we must also be practical. For 7 years we have not asked for any donations, and have built this project with our own funds as we grew. We are now experiencing ever increasing growing pains due to the large number of websites and projects we represent. So we have just installed donation buttons on our websites and ask that you consider this when you visit them. Nothing is too small. We thank you for all your support and your considerations … (TLB)
••••
Comment Policy: As a privately owned web site, we reserve the right to remove comments that contain spam, advertising, vulgarity, threats of violence, racism, or personal/abusive attacks on other users. This also applies to trolling, the use of more than one alias, or just intentional mischief. Enforcement of this policy is at the discretion of this websites administrators. Repeat offenders may be blocked or permanently banned without prior warning.
••••
Disclaimer: TLB websites contain copyrighted material the use of which has not always been specifically authorized by the copyright owner. We are making such material available to our readers under the provisions of “fair use” in an effort to advance a better understanding of political, health, economic and social issues. The material on this site is distributed without profit to those who have expressed a prior interest in receiving it for research and educational purposes. If you wish to use copyrighted material for purposes other than “fair use” you must request permission from the copyright owner.
••••
Disclaimer: The information and opinions shared are for informational purposes only including, but not limited to, text, graphics, images and other material are not intended as medical advice or instruction. Nothing mentioned is intended to be a substitute for professional medical advice, diagnosis or treatment.


Leave a Reply